Linear Regression and Correlation
47 Linear Equations
Linear regression for two variables is based on a linear equation with one independent
variable. The equation has the form:
$$y=a+bx$$
where a and b are constant numbers.
The variable x is the independent variable, and y is the dependent variable. Typically, you choose a value to substitute for the independent variable and then solve for the dependent variable.
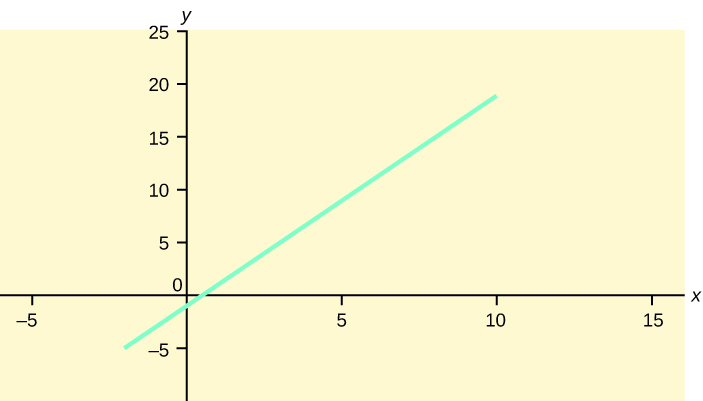
The graph of a linear equation of the form y = a + bx is a straight line. Any line that is not vertical can be described by some linear equation.
Example 12.3
Aaron’s Word Processing Service (AWPS) does word processing. The rate for services is \$32 per hour plus a \$31.50 one-time charge. The total cost to a customer depends on the number of hours it takes to complete the job.
Find the equation that expresses the total cost in terms of the number of hours required to complete the job.
Try It 12.3
Emma’s Extreme Sports hires hang-gliding instructors and pays them a fee of \$50 per class as well as $20 per student in the class. The total cost Emma pays depends on the number of students in a class. Find the equation that expresses the total cost in terms of the number of students in a class.
Slope and Y-Intercept of a Linear Equation
For the linear equation y = a + bx, b = slope and a = y-intercept. From algebra recall that the slope is a number that describes the steepness of a line, and the y-intercept is the y coordinate of the point (0, a) where the line crosses the y-axis.

Example 12.4
Svetlana tutors to make extra money for college. For each tutoring session, she charges a one-time fee of \$25 plus \$15 per hour of tutoring. A linear equation that expresses the total amount of money Svetlana earns for each session she tutors is y = 25 + 15x.
What are the independent and dependent variables? What is the y-intercept and what is the slope? Interpret them using complete sentences.
Try It 12.4
Ethan repairs household appliances like dishwashers and refrigerators. For each visit, he charges \$25 plus \$20 per hour of work. A linear equation that expresses the total amount of money Ethan earns per visit is y = 25 + 20x.
What are the independent and dependent variables? What is the y-intercept and what is the slope? Interpret them using complete sentences.


